> ## Documentation Index
> Fetch the complete documentation index at: https://docs.citivus.com/llms.txt
> Use this file to discover all available pages before exploring further.
# Sidebar navigation
> Find your way around Citivus — every page, every feature, one click away.
The Citivus sidebar is your main navigation tool. It's always visible on the left side of the screen and organizes all pages into two sections: **General** (your analytics) and **Settings** (your account management).
## Sidebar structure
### Brand selector
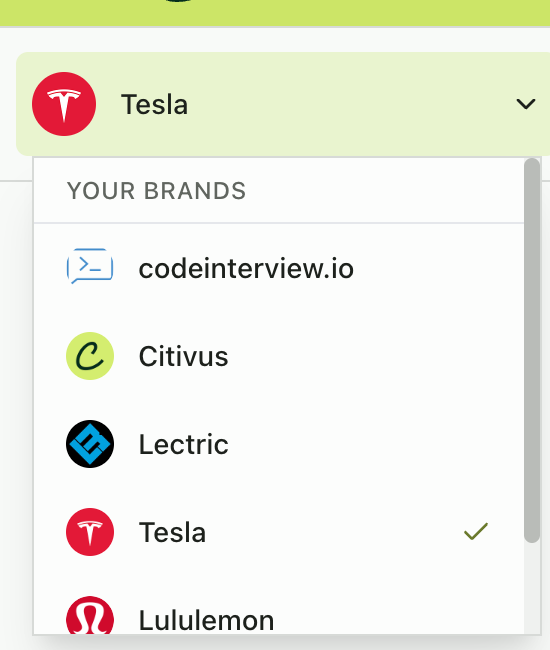
At the very top of the sidebar, below the Citivus logo, is the **brand selector**. This dropdown shows your currently active brand and lets you switch between brands if you monitor more than one.
* Click the brand selector to see all your brands
* Selecting a different brand immediately updates all dashboard data
* You can also **add a new brand** from here
 ### General section
These are your core analytics pages:
| Page | What it does |
| ------------------- | -------------------------------------------------------------------------------------------------------------------------------------------------- |
| **Overview** | Your main dashboard — metric cards, visibility chart, ranking table, performance summaries, and source breakdown |
| **Prompts Monitor** | Manage and analyze all your monitored prompts. View status, mention rates, rankings, and sentiment. Click any prompt for a detailed analysis page. |
| **Competitors** | Track competitor performance, compare rankings, and discover emerging threats. Add and manage the brands you compete against in AI search. |
| **Sources** | Analyze which websites and URLs appear in AI responses. See citation breakdowns, share of voice by source, and identify content gaps. |
### Settings section
Account management and configuration pages:
| Page | What it does |
| --------------- | ------------------------------------------------------------------------------------------------------- |
| **My Team** | Manage workspace members — invite new members, assign roles (Admin/Editor), and control access |
| **Preferences** | Account settings hub with sub-sections for security, brands, usage, notifications, billing, and privacy |
| **Get Help** | Access support resources and documentation |
***
## Page details
### Overview
The command center for your brand's AI presence. See the Understanding your performance guide for a complete walkthrough.
**Key sections:**
* Five metric cards (Mention Rate, Net Sentiment, Total Mentions, Citations, Unique Sources)
* Visibility score time-series chart
* Competitive ranking table
* AI providers performance breakdown
* Prompt performance (Top Performing / Needs Attention)
* Source breakdown bar chart
**Filters available:** Time range, AI provider, Location
### Prompts Monitor
Your prompt management and analysis hub. See the setup guide for detailed guidance.
**Key features:**
* **Smart insights carousel** — AI-generated observations about your prompt performance
* **New insights countdown** — Shows when the next batch of data will arrive
* **Summary statistics** — Active/inactive prompt counts, aggregate mention rate, ranking achievements, prompts needing attention
* **Prompt table** — Sortable columns: Prompt Details, Status, Mention Rate, Avg Rank, Net Sentiment, Provider, Location, Actions
* **Active/stopped toggle** — Switch between active and paused prompts
* **Search and filters** — Find specific prompts by text, category, provider, or location
* **New prompt button** — Add new prompts to your monitoring
* **Export** — Download prompt data
**Clicking a prompt** opens the **prompt detail page** with:
* Status, total responses, last run, frequency
* Mention rate, avg rank, net sentiment, total mentions, providers
Your brand vs. all brands mentioned in responses for this prompt.
Share of voice, mention rate, and location analysis with charts.
Tabbed view of the most recent response per provider.
Expandable daily response cards with full chat details.
Bar chart of most-cited domains for this prompt.
### Competitors
Competitive intelligence and threat detection. See the setup guide for detailed guidance.
**Two tabs:**
* Competitor table with columns: Competitor (with co-mentions), Avg Rank, Mentions, Citations, Share of Voice, Growth, Threat Level, Actions
* Add Competitor button
* Export functionality
* Auto-detected brands appearing in your AI results that you haven't added as competitors
* Each threat card shows: Brand name, first seen date, threat classification, threat score (1-10), total mentions, key metrics, AI-generated suggestions
* "Track" button to start monitoring an emerging threat as a full competitor
**Competitor comparison** — Click a competitor name for a head-to-head analysis.
### Sources
Source and citation analytics. See the guide for detailed guidance.
**Key sections:**
* Citations breakdown horizontal bar chart
* Four metric cards (Total Unique Domains, Total URLs, My Brand Citations, Top Domain)
* **Domains tab** — Table with: # Citations, Domain, URLs count, Mentions indicator, Competition Mentions, Share of Voice
* **URLs tab** — Same structure but at the individual page level
* Pagination for large datasets
* Search and Export
### My Team
Workspace member management:
* **Invite member button** — Send email invitations to new team members
* **Members table** — Columns: Name, Email, Roles, Status, Joined At, Actions
* **Role management** — Edit button to change member roles (Admin/Editor)
* **Member removal** — Remove button to revoke workspace access
* **Status filtering** — Filter by Active, Pending, etc.
* **Search** — Find members by name or email
### Preferences
Your account settings hub with six sub-sections:
| Section | What you can do |
| ----------------------- | ----------------------------------------------------------------- |
| **Password & security** | Request a password change via secure email link |
| **Brands** | View and manage brands associated with your workspace |
| **Tenant usage & info** | View current plan usage, prompt limits, location quotas |
| **Notifications** | Configure email notification preferences |
| **Billing & plans** | Manage subscription, view invoices, access Stripe customer portal |
| **Data & privacy** | Control data retention and privacy settings |
***
## Top header bar
Across the top of every page, you'll find:
* **Dark/light mode toggle** — Switch between the theme modes for comfortable viewing
* **User profile dropdown** — Shows your name and email, with access to profile and logout options
## Breadcrumb navigation
Every page includes a **breadcrumb trail** at the top (e.g., "Home > Prompts Monitor > \[Prompt Name]"). Click any breadcrumb to navigate back to that level.
## Collapse sidebar
At the bottom of the sidebar, a **collapse button** lets you minimize the sidebar to icon-only mode, giving your main content area more screen real estate. Click it again to expand.
### General section
These are your core analytics pages:
| Page | What it does |
| ------------------- | -------------------------------------------------------------------------------------------------------------------------------------------------- |
| **Overview** | Your main dashboard — metric cards, visibility chart, ranking table, performance summaries, and source breakdown |
| **Prompts Monitor** | Manage and analyze all your monitored prompts. View status, mention rates, rankings, and sentiment. Click any prompt for a detailed analysis page. |
| **Competitors** | Track competitor performance, compare rankings, and discover emerging threats. Add and manage the brands you compete against in AI search. |
| **Sources** | Analyze which websites and URLs appear in AI responses. See citation breakdowns, share of voice by source, and identify content gaps. |
### Settings section
Account management and configuration pages:
| Page | What it does |
| --------------- | ------------------------------------------------------------------------------------------------------- |
| **My Team** | Manage workspace members — invite new members, assign roles (Admin/Editor), and control access |
| **Preferences** | Account settings hub with sub-sections for security, brands, usage, notifications, billing, and privacy |
| **Get Help** | Access support resources and documentation |
***
## Page details
### Overview
The command center for your brand's AI presence. See the Understanding your performance guide for a complete walkthrough.
**Key sections:**
* Five metric cards (Mention Rate, Net Sentiment, Total Mentions, Citations, Unique Sources)
* Visibility score time-series chart
* Competitive ranking table
* AI providers performance breakdown
* Prompt performance (Top Performing / Needs Attention)
* Source breakdown bar chart
**Filters available:** Time range, AI provider, Location
### Prompts Monitor
Your prompt management and analysis hub. See the setup guide for detailed guidance.
**Key features:**
* **Smart insights carousel** — AI-generated observations about your prompt performance
* **New insights countdown** — Shows when the next batch of data will arrive
* **Summary statistics** — Active/inactive prompt counts, aggregate mention rate, ranking achievements, prompts needing attention
* **Prompt table** — Sortable columns: Prompt Details, Status, Mention Rate, Avg Rank, Net Sentiment, Provider, Location, Actions
* **Active/stopped toggle** — Switch between active and paused prompts
* **Search and filters** — Find specific prompts by text, category, provider, or location
* **New prompt button** — Add new prompts to your monitoring
* **Export** — Download prompt data
**Clicking a prompt** opens the **prompt detail page** with:
* Status, total responses, last run, frequency
* Mention rate, avg rank, net sentiment, total mentions, providers
Your brand vs. all brands mentioned in responses for this prompt.
Share of voice, mention rate, and location analysis with charts.
Tabbed view of the most recent response per provider.
Expandable daily response cards with full chat details.
Bar chart of most-cited domains for this prompt.
### Competitors
Competitive intelligence and threat detection. See the setup guide for detailed guidance.
**Two tabs:**
* Competitor table with columns: Competitor (with co-mentions), Avg Rank, Mentions, Citations, Share of Voice, Growth, Threat Level, Actions
* Add Competitor button
* Export functionality
* Auto-detected brands appearing in your AI results that you haven't added as competitors
* Each threat card shows: Brand name, first seen date, threat classification, threat score (1-10), total mentions, key metrics, AI-generated suggestions
* "Track" button to start monitoring an emerging threat as a full competitor
**Competitor comparison** — Click a competitor name for a head-to-head analysis.
### Sources
Source and citation analytics. See the guide for detailed guidance.
**Key sections:**
* Citations breakdown horizontal bar chart
* Four metric cards (Total Unique Domains, Total URLs, My Brand Citations, Top Domain)
* **Domains tab** — Table with: # Citations, Domain, URLs count, Mentions indicator, Competition Mentions, Share of Voice
* **URLs tab** — Same structure but at the individual page level
* Pagination for large datasets
* Search and Export
### My Team
Workspace member management:
* **Invite member button** — Send email invitations to new team members
* **Members table** — Columns: Name, Email, Roles, Status, Joined At, Actions
* **Role management** — Edit button to change member roles (Admin/Editor)
* **Member removal** — Remove button to revoke workspace access
* **Status filtering** — Filter by Active, Pending, etc.
* **Search** — Find members by name or email
### Preferences
Your account settings hub with six sub-sections:
| Section | What you can do |
| ----------------------- | ----------------------------------------------------------------- |
| **Password & security** | Request a password change via secure email link |
| **Brands** | View and manage brands associated with your workspace |
| **Tenant usage & info** | View current plan usage, prompt limits, location quotas |
| **Notifications** | Configure email notification preferences |
| **Billing & plans** | Manage subscription, view invoices, access Stripe customer portal |
| **Data & privacy** | Control data retention and privacy settings |
***
## Top header bar
Across the top of every page, you'll find:
* **Dark/light mode toggle** — Switch between the theme modes for comfortable viewing
* **User profile dropdown** — Shows your name and email, with access to profile and logout options
## Breadcrumb navigation
Every page includes a **breadcrumb trail** at the top (e.g., "Home > Prompts Monitor > \[Prompt Name]"). Click any breadcrumb to navigate back to that level.
## Collapse sidebar
At the bottom of the sidebar, a **collapse button** lets you minimize the sidebar to icon-only mode, giving your main content area more screen real estate. Click it again to expand.