> ## Documentation Index
> Fetch the complete documentation index at: https://docs.citivus.com/llms.txt
> Use this file to discover all available pages before exploring further.
# Understanding your performance
> Your Overview dashboard is the pulse of your brand's AI presence — here's how to read it.
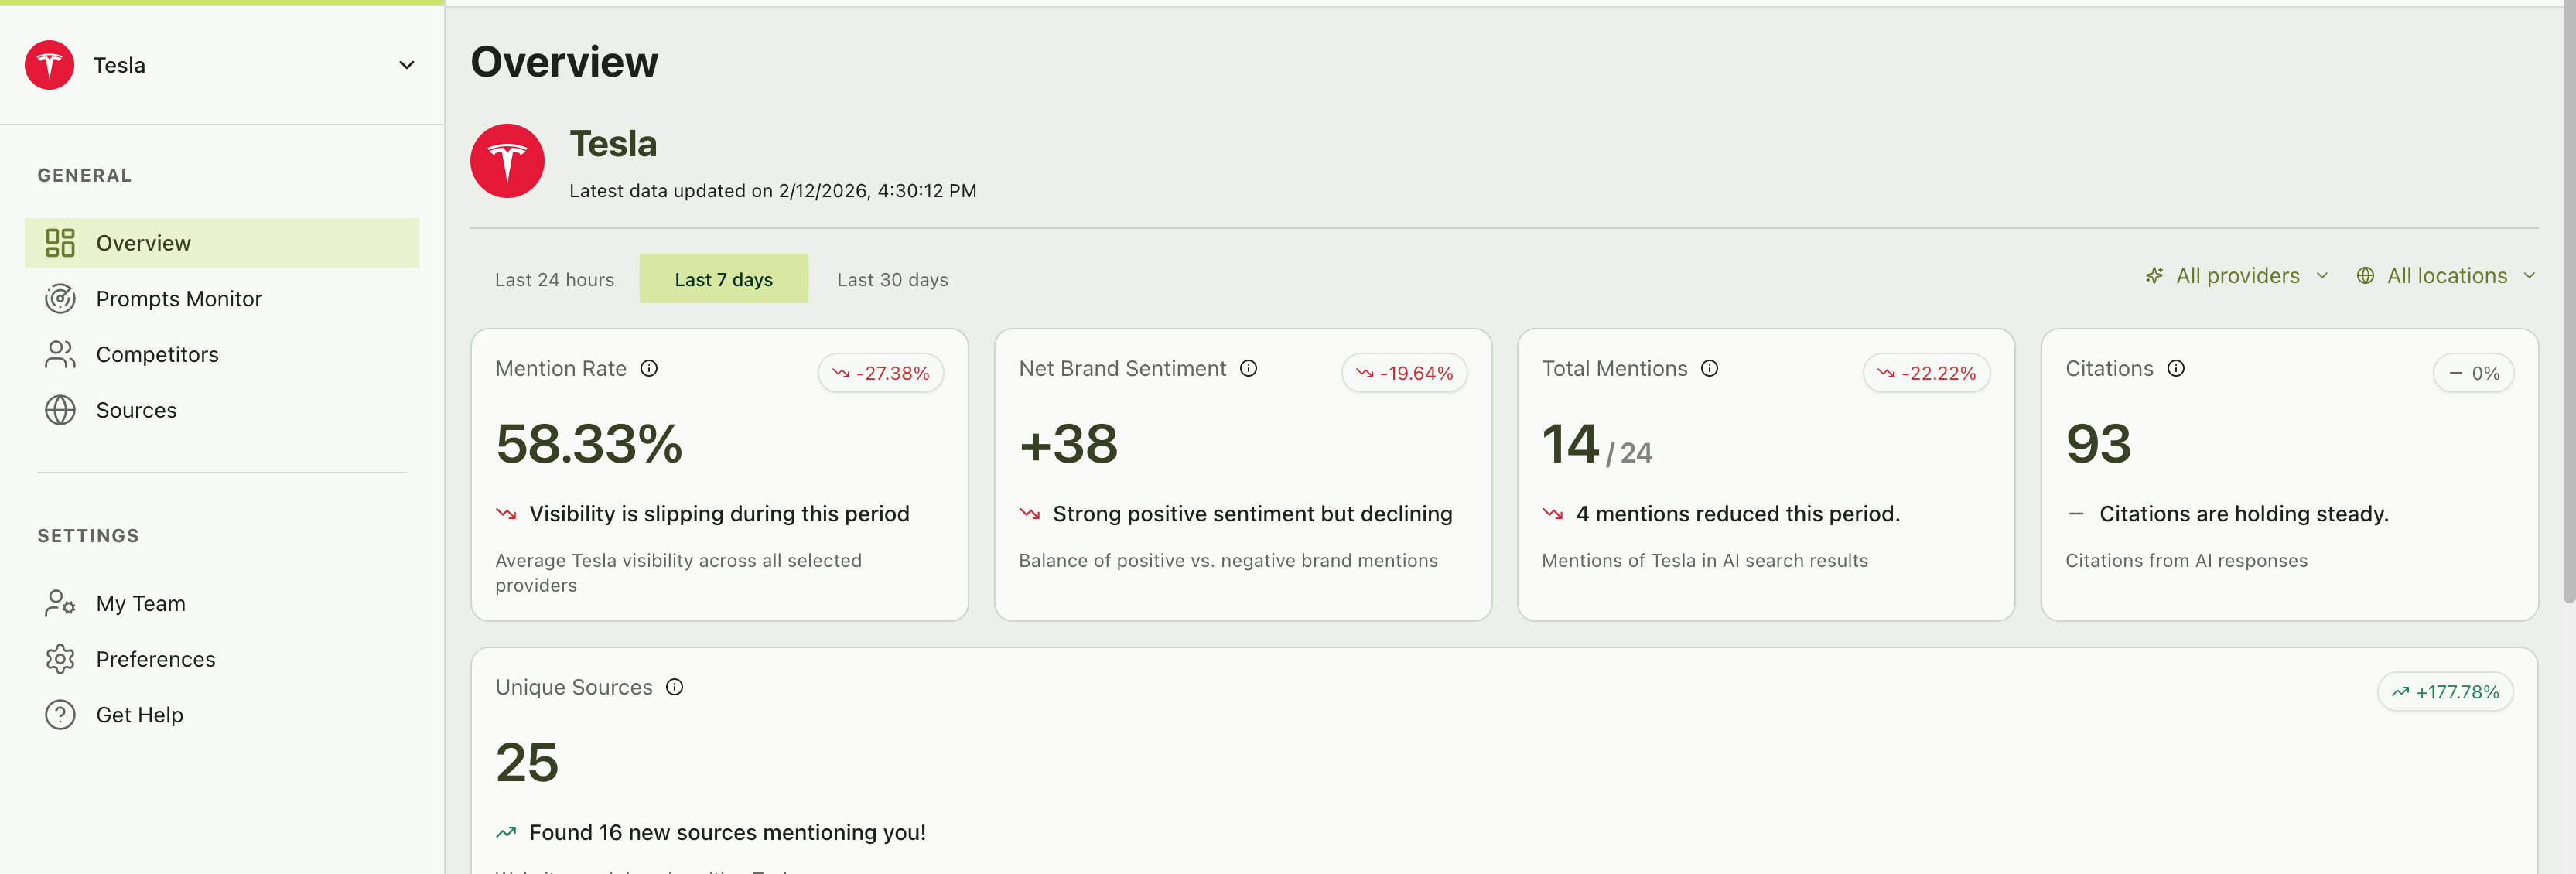
The **Overview** page is the first thing you see when you log into Citivus. It aggregates all your prompt, competitor, and source data into a single, actionable dashboard. This guide walks you through every section so you can extract maximum value from your analytics.
## The Overview header
At the top of the Overview page, you'll see your **brand name and logo** for the currently selected brand, along with the **latest data timestamp** showing when the most recent prompt run completed.
Below that, **filters** let you control the data scope:
* **Time range** — Last 24 hours, Last 7 days, Last 30 days
* **Provider filter** — All providers, or a specific one (ChatGPT, Perplexity, AI Overview)
* **Location filter** — All locations, or a specific market
Start with "Last 7 days" and "All providers" for a balanced view. Narrow down to specific providers or time ranges when investigating specific trends.
## Key metric cards
Five metric cards span the top of the dashboard. Each shows a current value, a change indicator (vs. the previous period), and a brief AI-generated insight.
**What it measures:** The percentage of AI responses that mention your brand across all monitored prompts and providers.
**How to read it:**
* **58.33%** means your brand appeared in roughly 58% of all AI responses
* **Change indicator** (e.g., "-27.38%") shows how this compares to the previous equivalent period
* A declining mention rate means AI assistants are mentioning your brand less frequently
**What to do:** If your mention rate is dropping, check the **Prompt Performance** section to identify which specific prompts lost mentions.
**What it measures:** The balance of positive versus negative sentiment across all mentions. Expressed as a number (e.g., "+38").
**How to read it:**
* **Positive numbers** (e.g., "+38") indicate more positive than negative mentions
* **Negative numbers** indicate the opposite
* The change indicator shows whether sentiment is trending up or down
**What to do:** If sentiment is declining despite stable mention rates, review individual chat responses to understand what's driving negative framing.
**What it measures:** The raw count of AI responses that mentioned your brand, shown as a fraction of total responses (e.g., "14 / 24").
**How to read it:**
* **14 / 24** means your brand was mentioned in 14 out of 24 total responses
* The change indicator shows whether you're being mentioned more or less than before
**What it measures:** The total number of source citations across all AI responses that mentioned your brand.
**How to read it:**
* A high citation count means AI providers are referencing many sources when discussing your brand
* Stable or growing citations suggest consistent source coverage
**What it measures:** The number of distinct websites and domains that appeared as citations alongside your brand.
**How to read it:**
* A growing number of unique sources means more websites are being associated with your brand in AI results
* The change indicator can be dramatic (e.g., "+177.78%") as new sources are discovered
 ## Visibility score chart
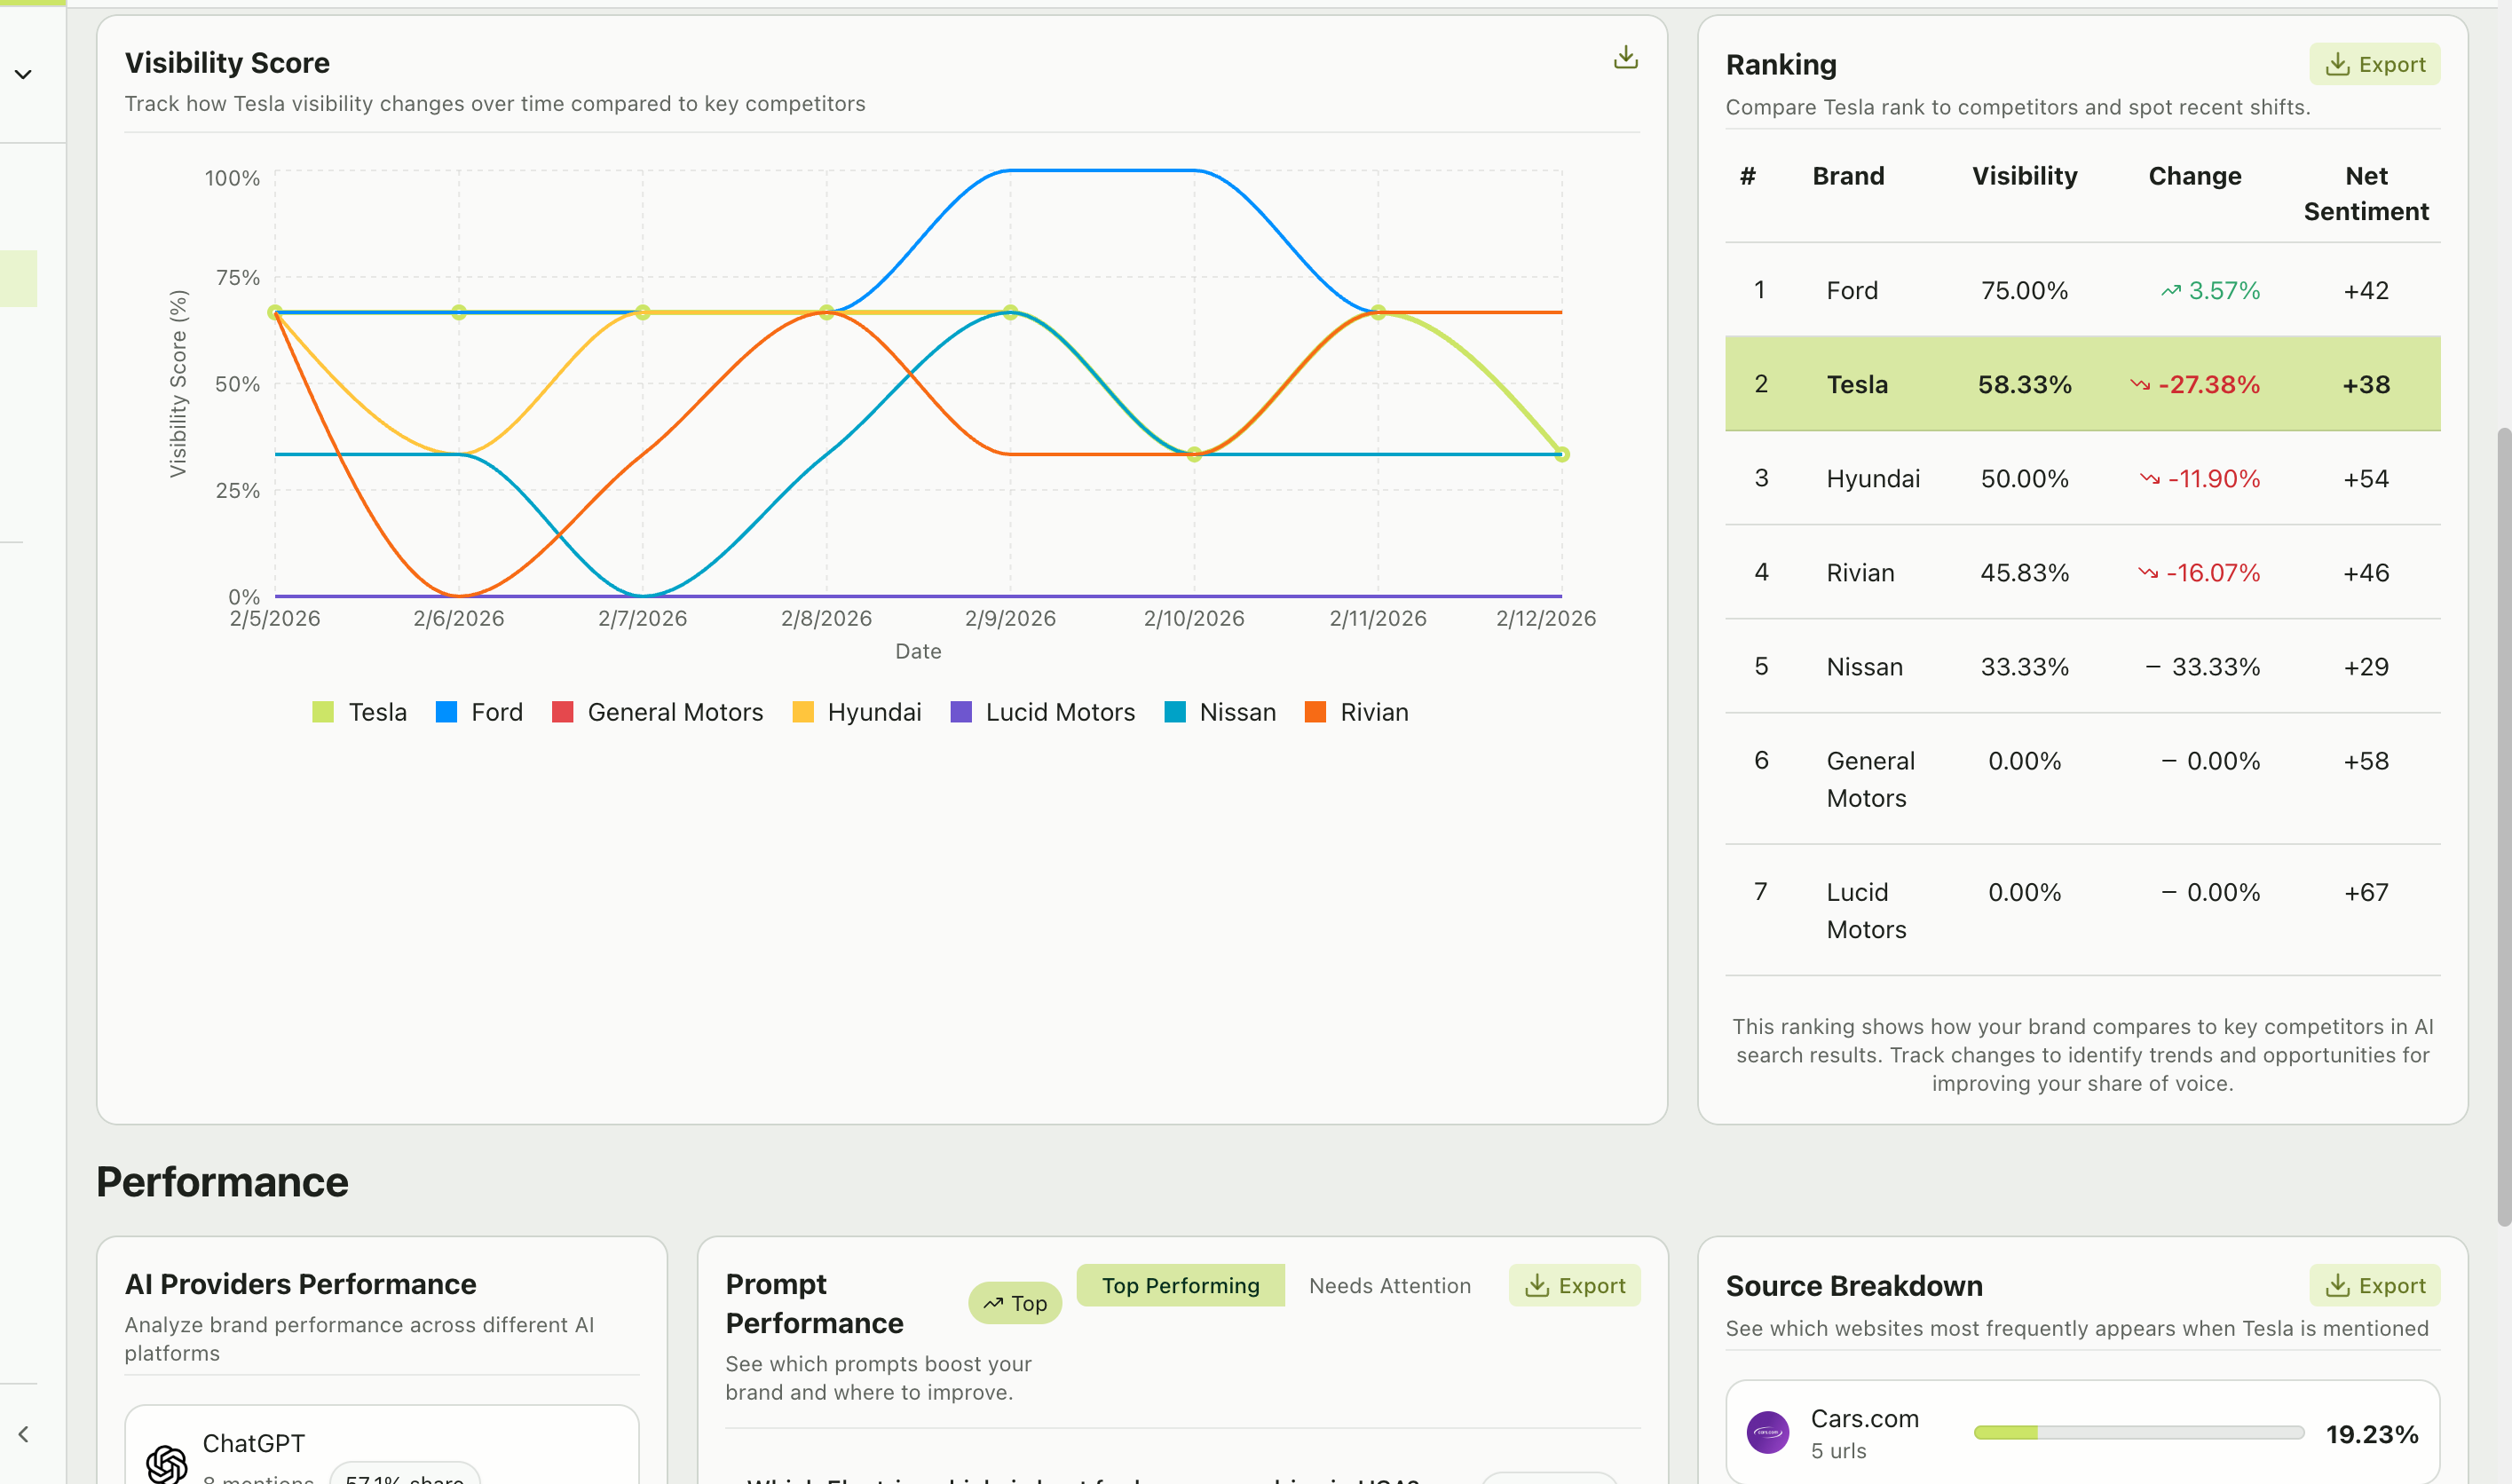
The **Visibility Score** chart is a time-series line graph that tracks your brand's visibility percentage over time, plotted alongside all your tracked competitors.
**How to read it:**
* The **Y-axis** shows visibility score from 0% to 100%
* The **X-axis** shows dates within your selected time range
* Each line represents a brand — yours plus your competitors
* **Higher is better** — a visibility score of 75% means that brand appeared in 75% of AI responses on that day
**What to look for:**
* **Your line trending upward** — Your AI presence is growing
* **Your line trending downward** — Check which prompts lost mentions
* **A competitor's line crossing above yours** — Dig into which prompts they're winning
* **Convergence** — All brands moving toward similar scores may indicate prompt saturation
**Visibility score vs. mention rate** — These are similar but not identical. **Mention Rate** is your aggregate percentage across the entire period. **Visibility Score** is plotted per day, showing the daily fluctuation. The chart helps you see *when* changes happened, while the metric card shows the overall picture.
## Visibility score chart
The **Visibility Score** chart is a time-series line graph that tracks your brand's visibility percentage over time, plotted alongside all your tracked competitors.
**How to read it:**
* The **Y-axis** shows visibility score from 0% to 100%
* The **X-axis** shows dates within your selected time range
* Each line represents a brand — yours plus your competitors
* **Higher is better** — a visibility score of 75% means that brand appeared in 75% of AI responses on that day
**What to look for:**
* **Your line trending upward** — Your AI presence is growing
* **Your line trending downward** — Check which prompts lost mentions
* **A competitor's line crossing above yours** — Dig into which prompts they're winning
* **Convergence** — All brands moving toward similar scores may indicate prompt saturation
**Visibility score vs. mention rate** — These are similar but not identical. **Mention Rate** is your aggregate percentage across the entire period. **Visibility Score** is plotted per day, showing the daily fluctuation. The chart helps you see *when* changes happened, while the metric card shows the overall picture.
 ## Ranking table
The **Ranking** table provides a competitive leaderboard — see exactly where your brand stands:
| Column | Description |
| ----------------- | ------------------------------------------------ |
| **#** | Position in the ranking (1 = most visible) |
| **Brand** | Brand name |
| **Visibility** | Mention rate for this brand |
| **Change** | Percentage point change from the previous period |
| **Net sentiment** | Overall sentiment score for this brand |
**What to look for:**
* **Your position** — Are you #1? If not, who's above you and why?
* **Change column** — Positive change means a brand is gaining ground; negative means they're losing it
* **Sentiment gaps** — A competitor with higher visibility but lower sentiment may be vulnerable
## Performance section
## Ranking table
The **Ranking** table provides a competitive leaderboard — see exactly where your brand stands:
| Column | Description |
| ----------------- | ------------------------------------------------ |
| **#** | Position in the ranking (1 = most visible) |
| **Brand** | Brand name |
| **Visibility** | Mention rate for this brand |
| **Change** | Percentage point change from the previous period |
| **Net sentiment** | Overall sentiment score for this brand |
**What to look for:**
* **Your position** — Are you #1? If not, who's above you and why?
* **Change column** — Positive change means a brand is gaining ground; negative means they're losing it
* **Sentiment gaps** — A competitor with higher visibility but lower sentiment may be vulnerable
## Performance section
 ### AI providers performance
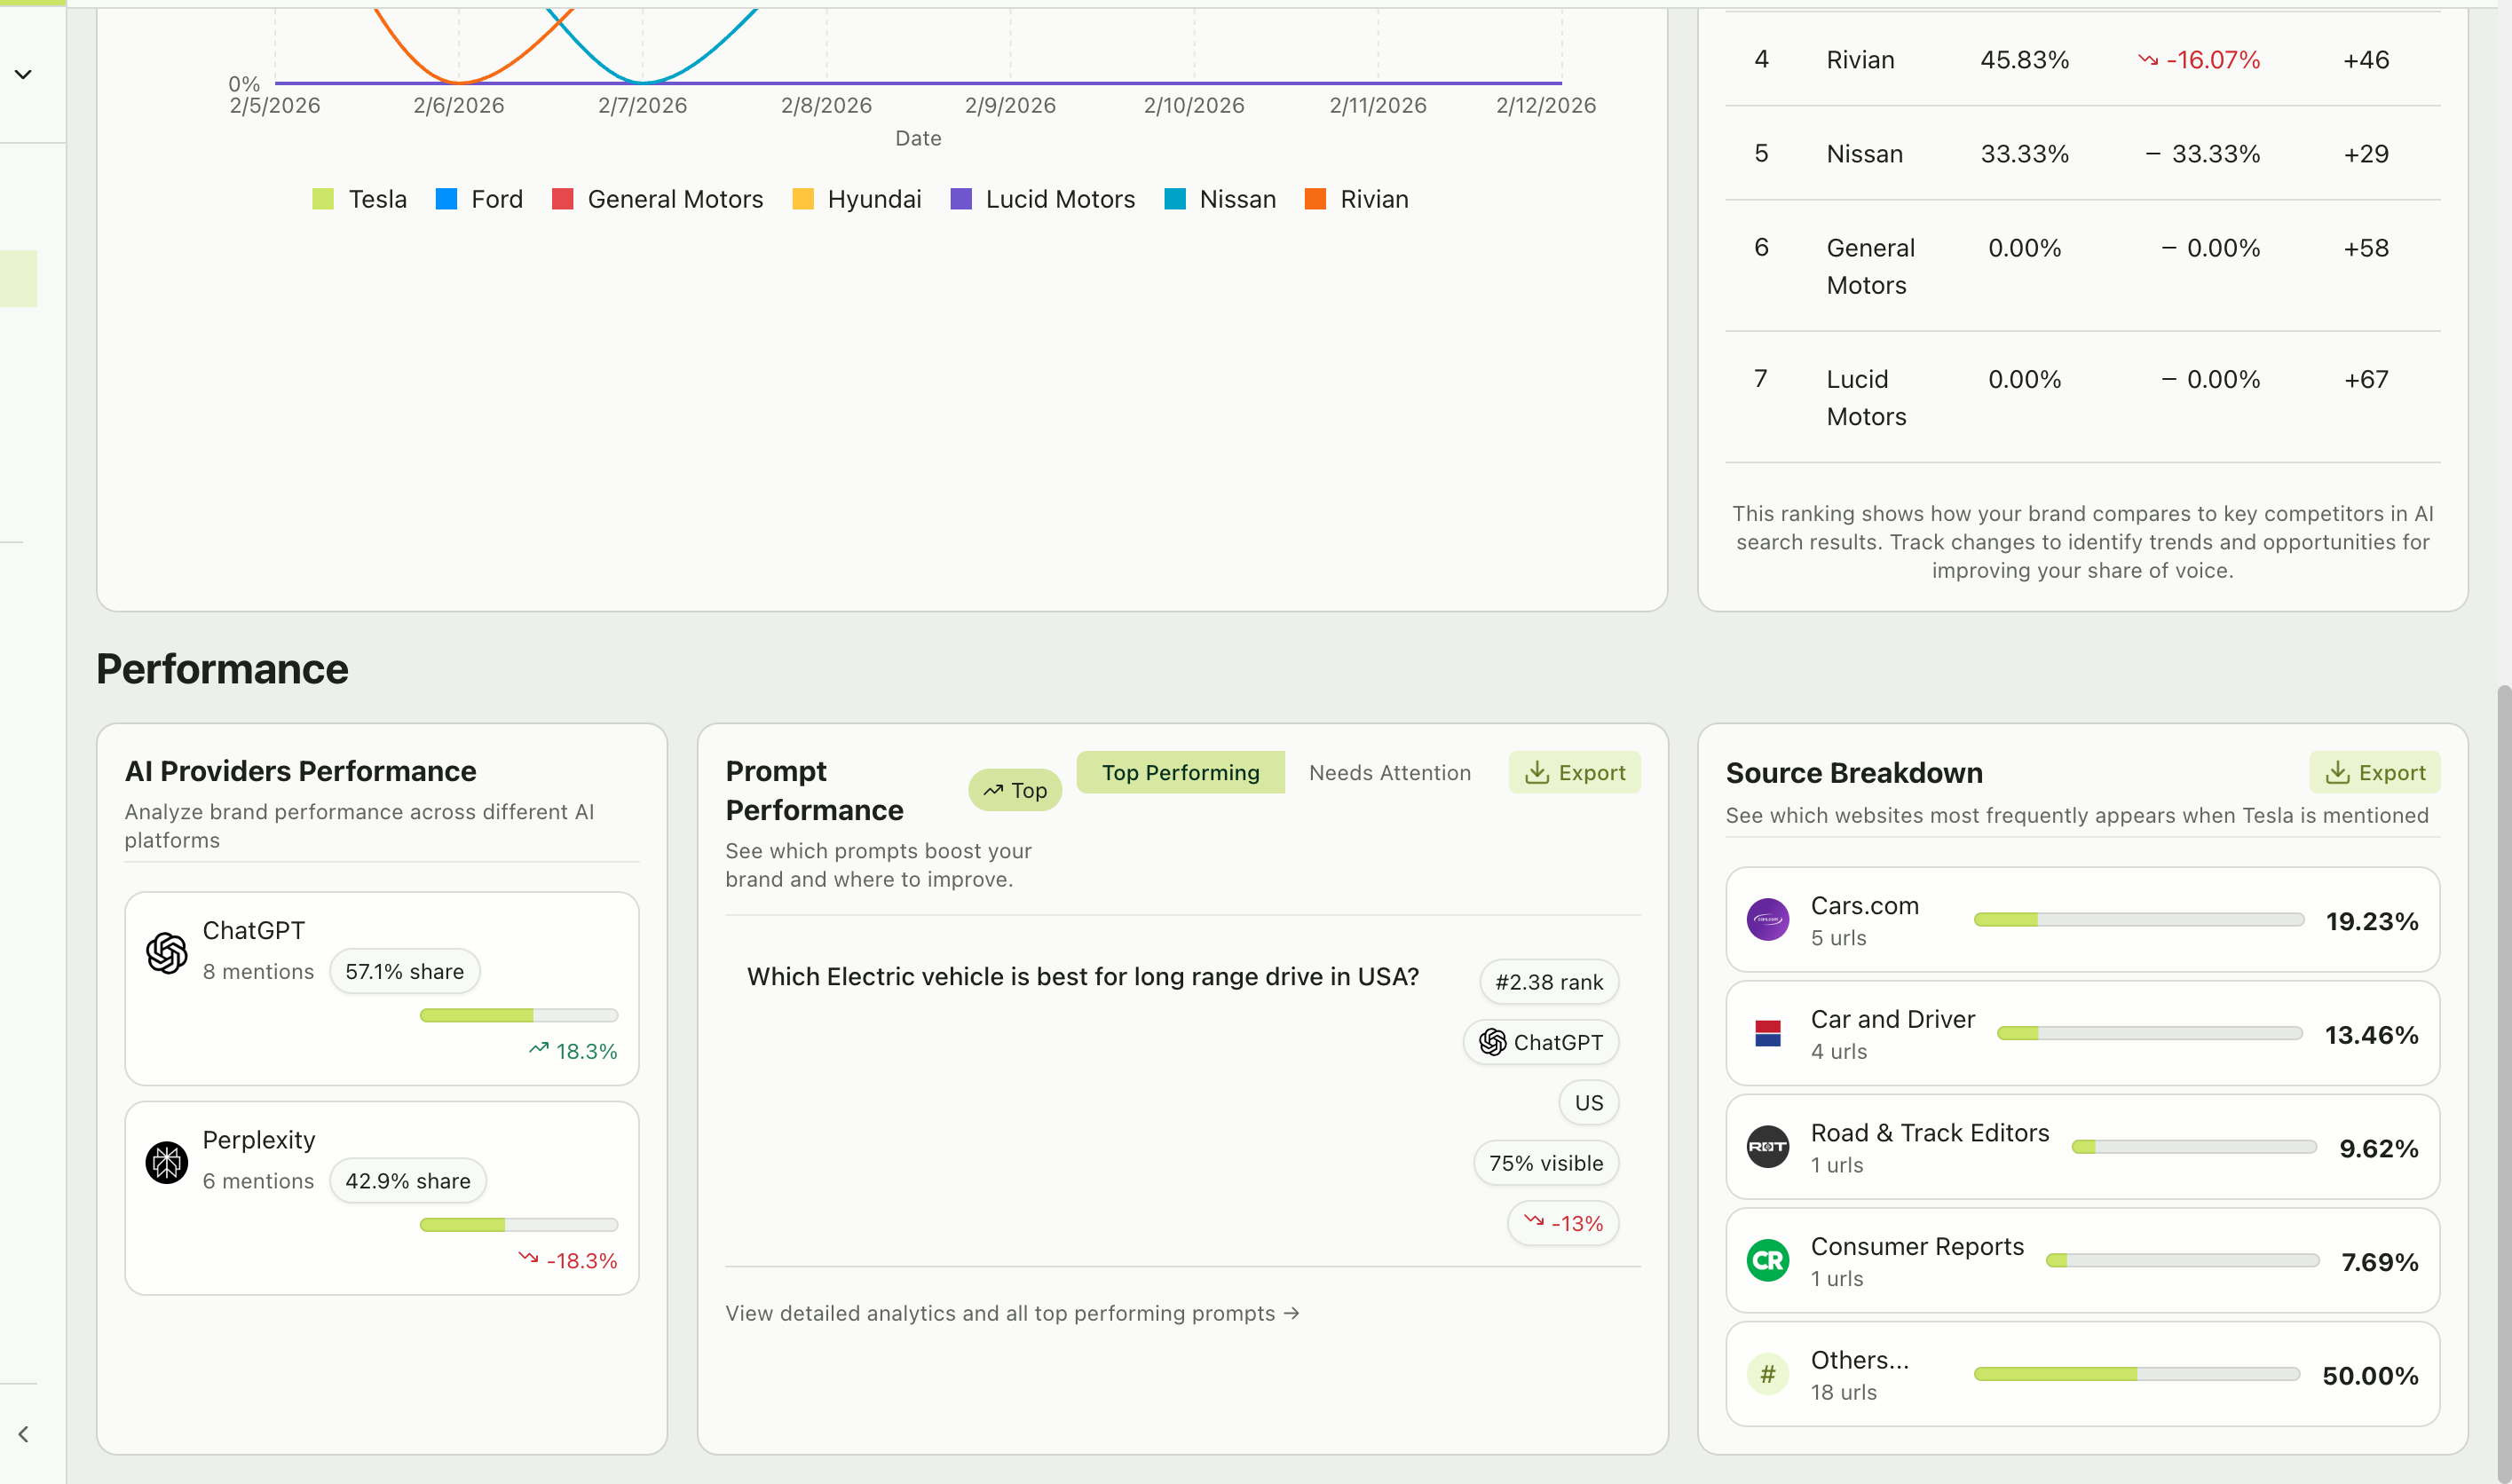
This section breaks down your brand's performance **by AI platform**. For each provider, you'll see:
* **Mention count** — How many responses from this provider mentioned your brand
* **Share percentage** — What portion of your total mentions comes from this provider
* **Change indicator** — Whether this provider's share is growing or shrinking
**Example reading:** "ChatGPT — 8 mentions, 57.1% share, +18.3%" means ChatGPT generated 8 mentions, which is 57.1% of your total, and that share grew by 18.3% compared to the previous period.
If one provider dominates your mention share, don't ignore the others. A diversified presence across all AI platforms is more resilient than relying on one.
### Prompt performance
Two views let you quickly assess your prompt portfolio:
Prompts where your brand has strong mention rates and high rankings. These are your wins — understand what makes these prompts work.
Prompts where your brand has low visibility or declining performance. These are your opportunities — focus optimization efforts here.
Each prompt row shows:
* The prompt text (clickable to view full details)
* Average rank
* Top provider
* Location
* Visibility percentage and change
Click **"View detailed analytics and all top performing prompts"** to navigate to the full Prompts Monitor page.
### Source breakdown
A bar chart showing which websites appear most frequently when your brand is mentioned. For each source domain, you'll see:
* **Domain name** and favicon
* **Number of URLs** from that domain
* **Percentage share** of total citations
**What to look for:**
* Which publications and websites drive the most AI citations in your space
* Whether your own website appears (and if not, that's a content gap to address)
* New sources appearing that weren't there before
## Smart insights carousel
On the **Prompts Monitor** page, you'll notice a **Smart Insights carousel** at the top. These are AI-generated observations about your performance, such as:
> "We detected 1 prompt(s) where your brand struggles to appear. It was mentioned in fewer than 30% of answers."
These insights are designed to quickly surface the most important things to pay attention to. Use the arrows to cycle through available insights.
## Exporting your data
Multiple sections across the dashboard include **Export** buttons. You can export:
* **Ranking tables** — Download competitive rankings as CSV
* **Prompt performance** — Export your prompt analytics
* **Source data** — Download citation and source information
This is useful for creating reports, sharing with stakeholders, or performing deeper analysis in spreadsheet tools.
### AI providers performance
This section breaks down your brand's performance **by AI platform**. For each provider, you'll see:
* **Mention count** — How many responses from this provider mentioned your brand
* **Share percentage** — What portion of your total mentions comes from this provider
* **Change indicator** — Whether this provider's share is growing or shrinking
**Example reading:** "ChatGPT — 8 mentions, 57.1% share, +18.3%" means ChatGPT generated 8 mentions, which is 57.1% of your total, and that share grew by 18.3% compared to the previous period.
If one provider dominates your mention share, don't ignore the others. A diversified presence across all AI platforms is more resilient than relying on one.
### Prompt performance
Two views let you quickly assess your prompt portfolio:
Prompts where your brand has strong mention rates and high rankings. These are your wins — understand what makes these prompts work.
Prompts where your brand has low visibility or declining performance. These are your opportunities — focus optimization efforts here.
Each prompt row shows:
* The prompt text (clickable to view full details)
* Average rank
* Top provider
* Location
* Visibility percentage and change
Click **"View detailed analytics and all top performing prompts"** to navigate to the full Prompts Monitor page.
### Source breakdown
A bar chart showing which websites appear most frequently when your brand is mentioned. For each source domain, you'll see:
* **Domain name** and favicon
* **Number of URLs** from that domain
* **Percentage share** of total citations
**What to look for:**
* Which publications and websites drive the most AI citations in your space
* Whether your own website appears (and if not, that's a content gap to address)
* New sources appearing that weren't there before
## Smart insights carousel
On the **Prompts Monitor** page, you'll notice a **Smart Insights carousel** at the top. These are AI-generated observations about your performance, such as:
> "We detected 1 prompt(s) where your brand struggles to appear. It was mentioned in fewer than 30% of answers."
These insights are designed to quickly surface the most important things to pay attention to. Use the arrows to cycle through available insights.
## Exporting your data
Multiple sections across the dashboard include **Export** buttons. You can export:
* **Ranking tables** — Download competitive rankings as CSV
* **Prompt performance** — Export your prompt analytics
* **Source data** — Download citation and source information
This is useful for creating reports, sharing with stakeholders, or performing deeper analysis in spreadsheet tools.