> ## Documentation Index
> Fetch the complete documentation index at: https://docs.citivus.com/llms.txt
> Use this file to discover all available pages before exploring further.
# Understanding sources
> Sources are the websites AI assistants cite when they talk about your brand — and they matter more than you think.
When ChatGPT recommends your product or Perplexity lists your brand alongside competitors, the AI doesn't make it up. It draws from **sources** — websites, articles, reviews, and data that inform its responses. Understanding these sources gives you a powerful edge: you can see exactly which content drives AI recommendations in your space.
## Why sources matter
Sources in AI search work differently than traditional SEO backlinks:
* **They influence what AI says about you** — If authoritative sources praise your brand, AI assistants are more likely to recommend you
* **They determine citation placement** — The sources an AI cites alongside your brand affect user trust and click-through behavior
* **They reveal content gaps** — If your competitors' websites appear as sources but yours doesn't, you have a content opportunity
* **They show the content ecosystem** — Understanding which publications AI trusts helps you prioritize PR and content partnerships
## The sources page
Navigate to **Sources** in the sidebar to access the full sources analytics dashboard.
 ### Citations breakdown chart
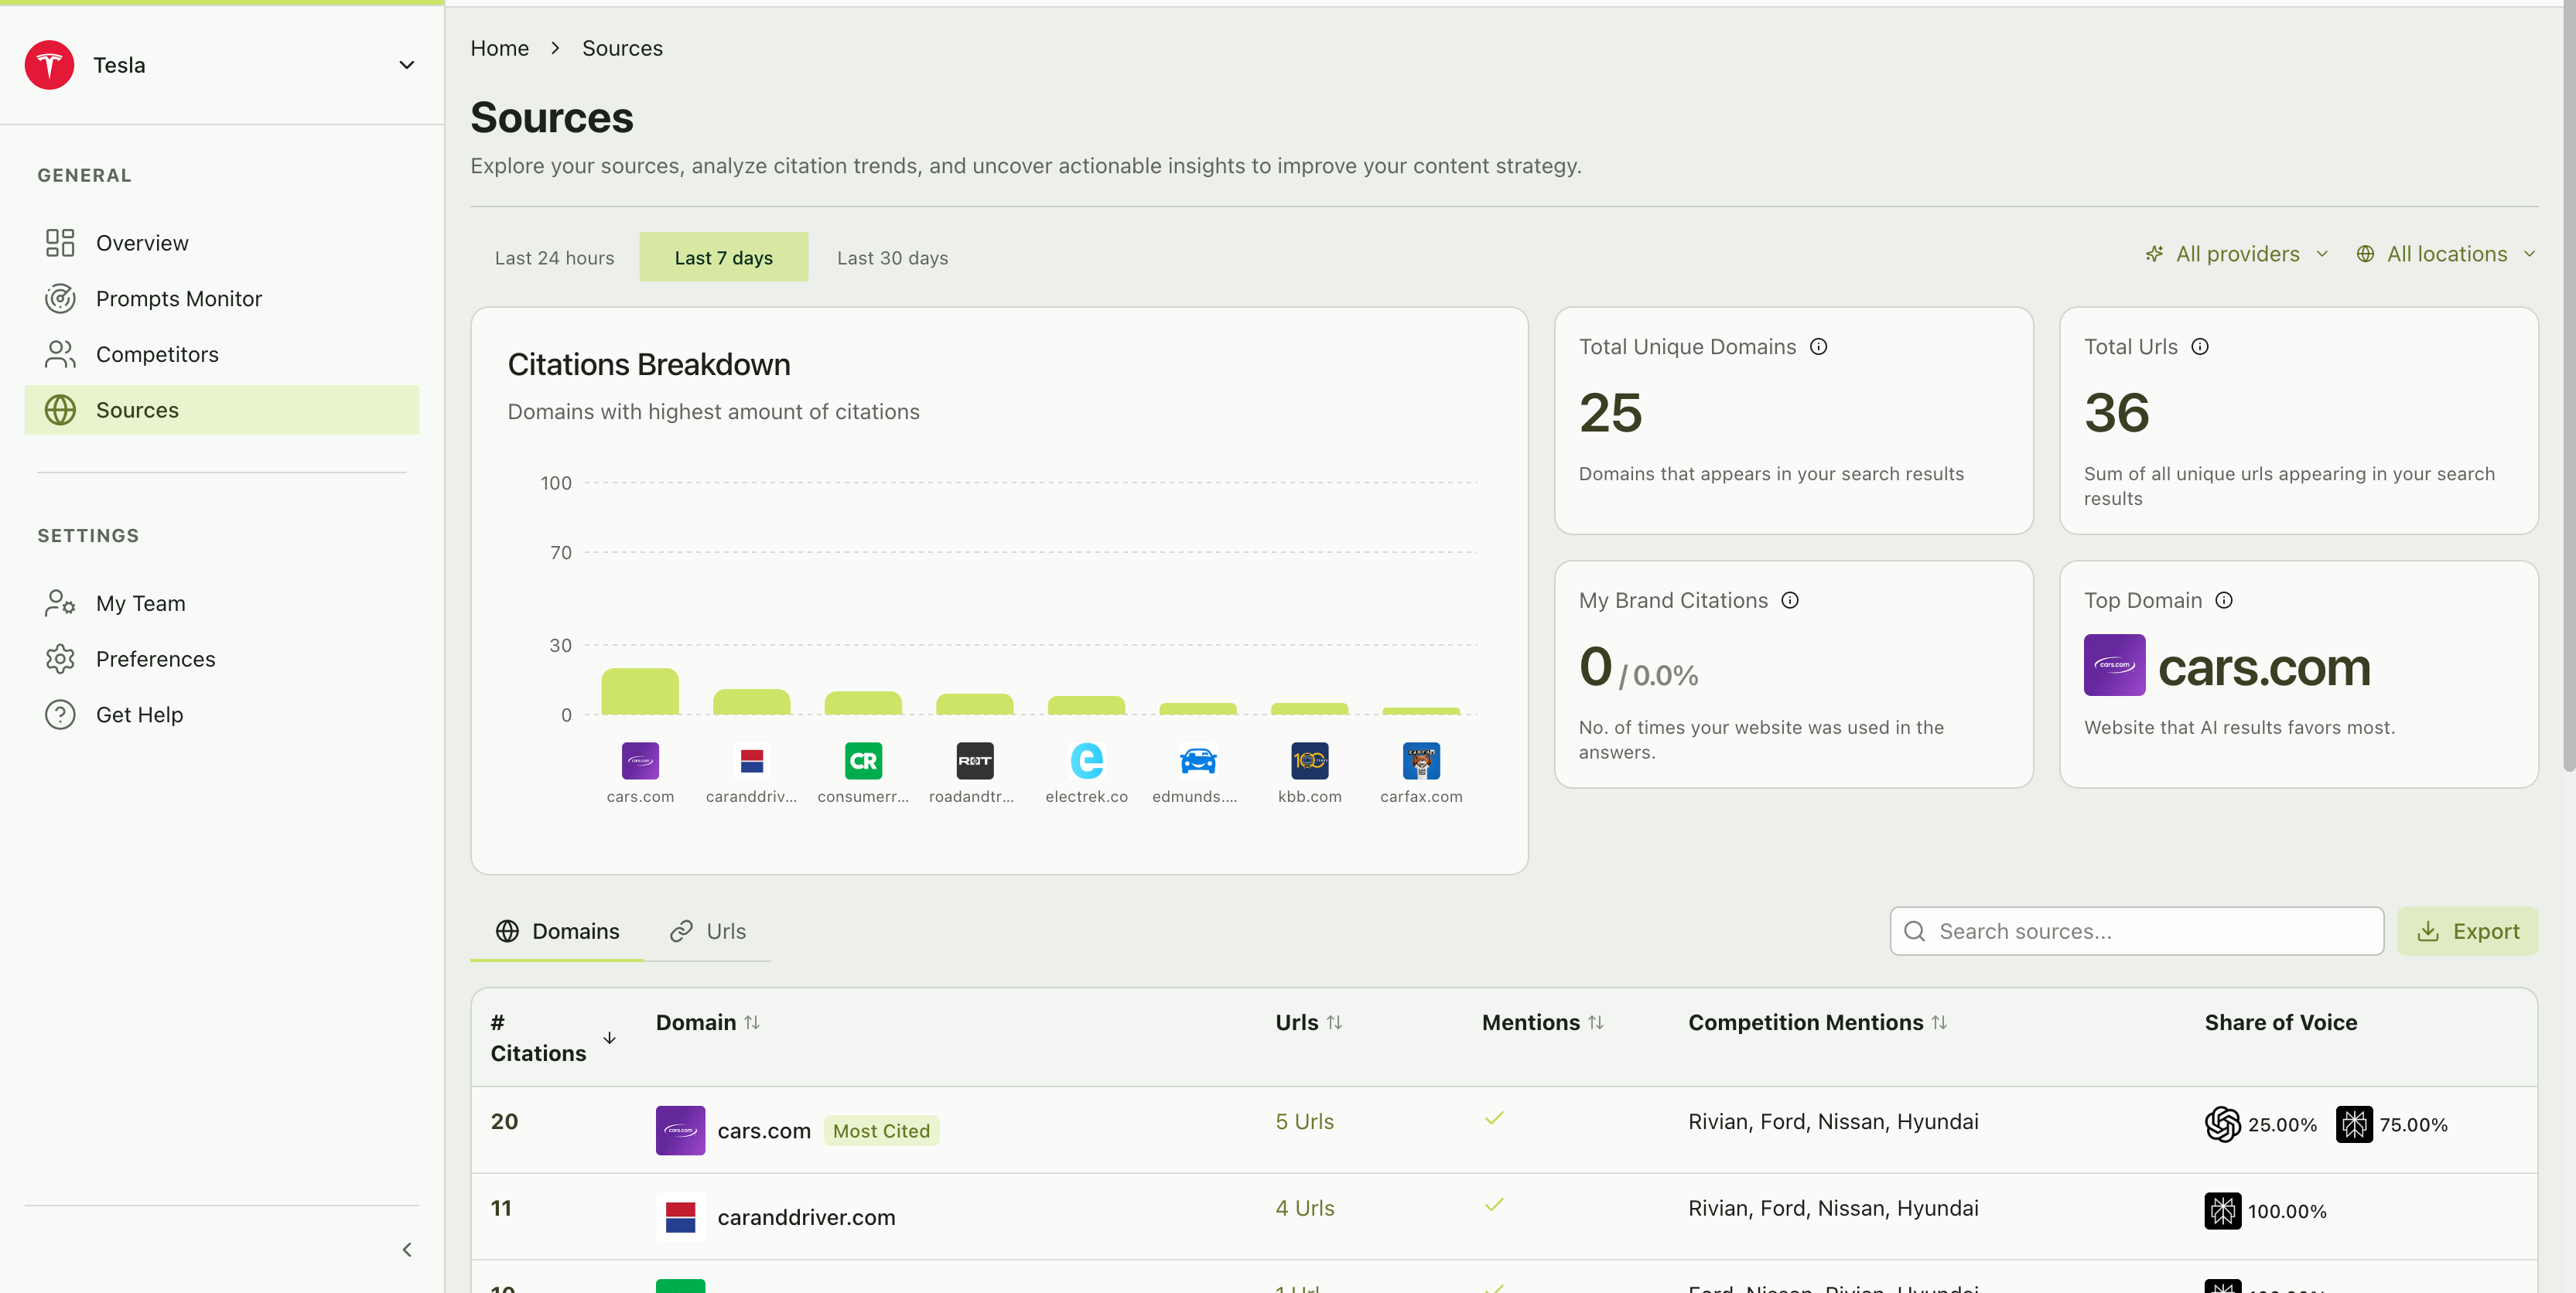
At the top, a **horizontal bar chart** shows the domains with the highest citation counts. This gives you an instant visual read on which websites dominate the AI conversation in your space.
### Source metric cards
Four metric cards provide a high-level summary:
The number of **distinct domains** (websites) that appeared in your AI search results during the selected time period. A higher number means AI assistants are pulling from a wider range of sources.
The total count of **unique URLs** (specific pages) appearing across all your search results. A single domain like cars.com might have 5 different URLs cited — each a different article or page. This metric shows the depth of source coverage.
**How many times your own website was cited** in AI responses, shown as a count and percentage of total citations.
If this number is 0, AI assistants are not citing your website when discussing your brand — a significant content gap. If it's high, your content is directly influencing AI recommendations.
The single domain that appears most frequently across all your AI search results. This is the website that AI assistants trust most in your industry.
**A zero for "My Brand Citations" doesn't mean you're invisible.** Your brand can be *mentioned* in AI responses without your *website* being cited. Mention rate tracks brand visibility. Source citations track which websites the AI references. They're related but different. Both matter.
## Domains tab
The **Domains** tab shows a detailed table of every domain that appeared in your AI search results:
| Column | What it shows |
| ------------------------ | -------------------------------------------------------------------------------------- |
| **# Citations** | Total number of times this domain was cited across all responses |
| **Domain** | The website domain name with favicon |
| **URLs** | Number of unique URLs from this domain |
| **Mentions** | Whether your brand was mentioned in responses citing this domain |
| **Competition mentions** | Which of your tracked competitors were mentioned alongside this domain |
| **Share of voice** | A two-part indicator showing your brand's share vs. competitors' share for this source |
### Share of voice indicators
Each domain row shows two colored indicators:
* **Green (your brand)** — The percentage of citations from this domain where your brand was also mentioned
* **Red (competitors)** — The percentage where competitors were mentioned but you weren't
**Example:** Cars.com showing "25.00% / 75.00%" means your brand was mentioned in 25% of responses that cited Cars.com, while competitors dominated 75%.
Focus on high-citation domains where your share of voice is low. These represent the biggest opportunities — the AI already trusts these sources, you just need to increase your presence through content, PR, or featured coverage.
The domain with the highest citation count gets a **"Most Cited"** badge.
## URLs tab
Click the **"URLs"** tab to switch from domain-level to **URL-level analysis**. This shows individual pages rather than entire websites — useful for identifying specific articles or content pieces that influence AI responses.
### Citations breakdown chart
At the top, a **horizontal bar chart** shows the domains with the highest citation counts. This gives you an instant visual read on which websites dominate the AI conversation in your space.
### Source metric cards
Four metric cards provide a high-level summary:
The number of **distinct domains** (websites) that appeared in your AI search results during the selected time period. A higher number means AI assistants are pulling from a wider range of sources.
The total count of **unique URLs** (specific pages) appearing across all your search results. A single domain like cars.com might have 5 different URLs cited — each a different article or page. This metric shows the depth of source coverage.
**How many times your own website was cited** in AI responses, shown as a count and percentage of total citations.
If this number is 0, AI assistants are not citing your website when discussing your brand — a significant content gap. If it's high, your content is directly influencing AI recommendations.
The single domain that appears most frequently across all your AI search results. This is the website that AI assistants trust most in your industry.
**A zero for "My Brand Citations" doesn't mean you're invisible.** Your brand can be *mentioned* in AI responses without your *website* being cited. Mention rate tracks brand visibility. Source citations track which websites the AI references. They're related but different. Both matter.
## Domains tab
The **Domains** tab shows a detailed table of every domain that appeared in your AI search results:
| Column | What it shows |
| ------------------------ | -------------------------------------------------------------------------------------- |
| **# Citations** | Total number of times this domain was cited across all responses |
| **Domain** | The website domain name with favicon |
| **URLs** | Number of unique URLs from this domain |
| **Mentions** | Whether your brand was mentioned in responses citing this domain |
| **Competition mentions** | Which of your tracked competitors were mentioned alongside this domain |
| **Share of voice** | A two-part indicator showing your brand's share vs. competitors' share for this source |
### Share of voice indicators
Each domain row shows two colored indicators:
* **Green (your brand)** — The percentage of citations from this domain where your brand was also mentioned
* **Red (competitors)** — The percentage where competitors were mentioned but you weren't
**Example:** Cars.com showing "25.00% / 75.00%" means your brand was mentioned in 25% of responses that cited Cars.com, while competitors dominated 75%.
Focus on high-citation domains where your share of voice is low. These represent the biggest opportunities — the AI already trusts these sources, you just need to increase your presence through content, PR, or featured coverage.
The domain with the highest citation count gets a **"Most Cited"** badge.
## URLs tab
Click the **"URLs"** tab to switch from domain-level to **URL-level analysis**. This shows individual pages rather than entire websites — useful for identifying specific articles or content pieces that influence AI responses.
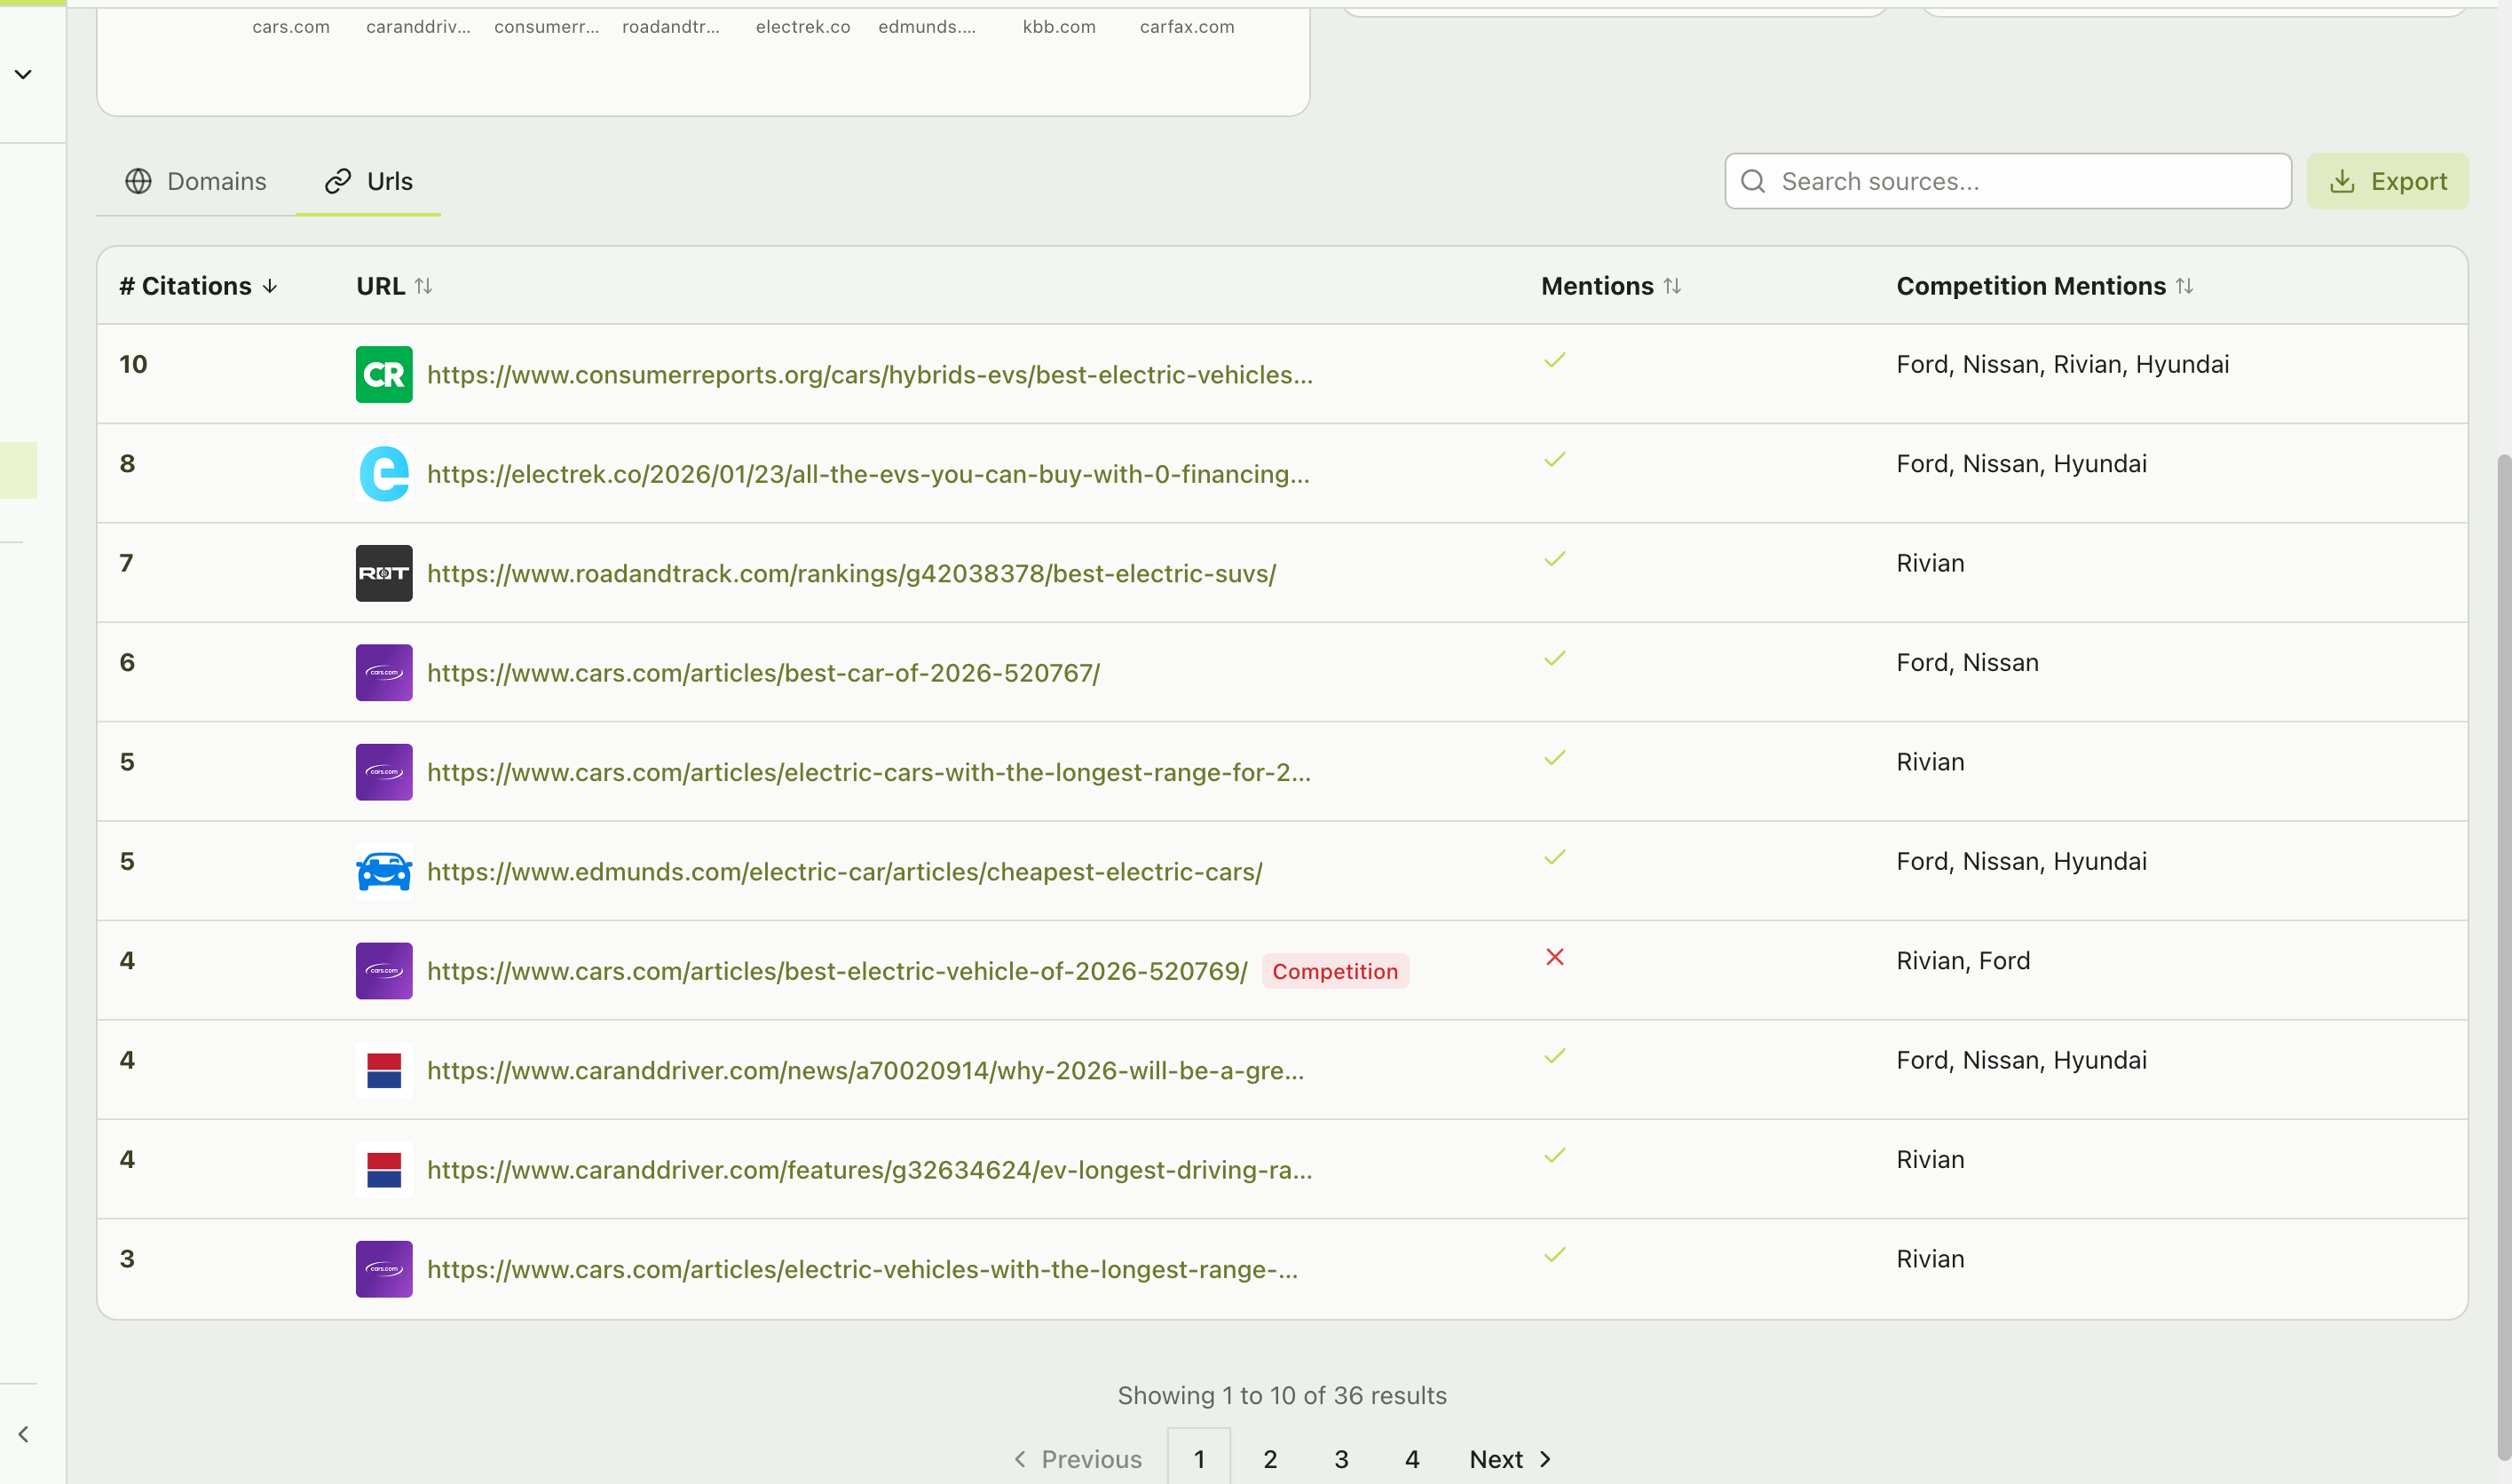 The table structure is similar to the Domains tab but at a more granular level, showing each specific URL and its citation metrics.
## How to use source insights
Look at high-citation domains where your **share of voice is 0%**. Research what content those domains have about your competitors and create strategies to get featured — through PR outreach, guest content, product reviews, or data partnerships.
Find domains where you have **some** share of voice but competitors have more. Identify the specific articles (URLs tab) and work on updating or enriching the content.
If your own website isn't appearing in citations, create comprehensive, authoritative content on your website that answers the same questions your prompts ask. AI assistants increasingly cite original, well-structured content.
Track your sources over time. New domains appearing could indicate a new publication gaining influence, competitor content efforts paying off, or shifts in which content AI providers prefer to cite.
## Source metrics deep dive
### Citation count
The total number of times a domain or URL was cited across all AI responses in your selected time period. Higher citation counts indicate more influential sources.
**Formula:** Sum of all citations of this domain/URL across all prompt responses.
### Share of voice (sources)
Your brand's citation share within responses that cite a specific domain.
**Formula:** (Responses citing this domain that mention your brand) / (Total responses citing this domain) x 100
**Source share of voice vs. brand share of voice** — Don't confuse these two metrics. **Brand Share of Voice** (on the Overview page) measures your brand's percentage of total mentions across all prompts. **Source Share of Voice** (on the Sources page) measures how often your brand appears *alongside specific sources*. They answer different questions.
### Competition mentions
Shows which of your tracked competitors appear in responses that cite each source. This helps you understand which sources are associated with which competitors.
## Filtering sources
Use the filter controls at the top of the Sources page to narrow your analysis:
* **Time range** — Last 24 hours, Last 7 days, Last 30 days
* **Provider filter** — See which sources specific AI platforms prefer
* **Location filter** — Analyze regional source differences
* **Search** — Use the search box to find specific domains or URLs in the table
The table structure is similar to the Domains tab but at a more granular level, showing each specific URL and its citation metrics.
## How to use source insights
Look at high-citation domains where your **share of voice is 0%**. Research what content those domains have about your competitors and create strategies to get featured — through PR outreach, guest content, product reviews, or data partnerships.
Find domains where you have **some** share of voice but competitors have more. Identify the specific articles (URLs tab) and work on updating or enriching the content.
If your own website isn't appearing in citations, create comprehensive, authoritative content on your website that answers the same questions your prompts ask. AI assistants increasingly cite original, well-structured content.
Track your sources over time. New domains appearing could indicate a new publication gaining influence, competitor content efforts paying off, or shifts in which content AI providers prefer to cite.
## Source metrics deep dive
### Citation count
The total number of times a domain or URL was cited across all AI responses in your selected time period. Higher citation counts indicate more influential sources.
**Formula:** Sum of all citations of this domain/URL across all prompt responses.
### Share of voice (sources)
Your brand's citation share within responses that cite a specific domain.
**Formula:** (Responses citing this domain that mention your brand) / (Total responses citing this domain) x 100
**Source share of voice vs. brand share of voice** — Don't confuse these two metrics. **Brand Share of Voice** (on the Overview page) measures your brand's percentage of total mentions across all prompts. **Source Share of Voice** (on the Sources page) measures how often your brand appears *alongside specific sources*. They answer different questions.
### Competition mentions
Shows which of your tracked competitors appear in responses that cite each source. This helps you understand which sources are associated with which competitors.
## Filtering sources
Use the filter controls at the top of the Sources page to narrow your analysis:
* **Time range** — Last 24 hours, Last 7 days, Last 30 days
* **Provider filter** — See which sources specific AI platforms prefer
* **Location filter** — Analyze regional source differences
* **Search** — Use the search box to find specific domains or URLs in the table